PC Plus HelpDesk - issue 272
 |
This month, Paul Grosse gives you more
insight into some of the topics dealt with in HelpDesk.
|
 |
HelpDesk
Preloading pings for quicker resultsSimple though it appears on the surface, ping is quite a powerful tool. Packets are sent out and returned and the round trip time is measured in microseconds. By monitoring pings carefully, you can tell when things have changed on a network - even if it is someone changing a patch cord - this is more about the location of a patch lead in terms of which socket it goes in because signals travel at around 100,000,000m/s along copper so adding a 5 metre length will add around 100ns to the round trip. However, something that you will notice on external pings is that different routes will show up.
If you use the '-l' switch (as in the screenshot), you can preload up to three packets, releasing them as fast as they will go - this is effectively the same as flood pinging only you are restricted to three packets. Of course, if you are root, there is no restriction. Here, I have used the 'time' command to show how
quickly the program runs and you can see that in real
time it took just 4ms to do the job. If you are using
this in an automated setting, you can also have a
time-out so that it won't take the default time out or
forever to finish. |
 In the screenshot, you can see that an
interval of 6 microseconds occurred between packets 13
and 15. In the screenshot, you can see that an
interval of 6 microseconds occurred between packets 13
and 15.If you are just sending out three packets to see if a machine is up, you don't have to be root and, you can get the result in a lot less than one second. |
Retrieve your asterisk - remove autoformatting
If you have been using email for a decade or so, you will be able to remember it before html email came along. At the time, if you wanted to make something stand out, you would bracket the text with '*' to embolden it and '_' to imply an underscore. You typed them and that was how they stayed. Everybody knew what it meant. Now, if you use and asterisk or an underscore, the word processor formats that text for you and you can see the symbols you wanted leaving alone disappearing in front of your eyes. However, not all is lost. |
 In OpenOffice.org, click on 'Tools',
'Autocorrect...' and then, on the AutoCorrect form, the
'Options' tab. In OpenOffice.org, click on 'Tools',
'Autocorrect...' and then, on the AutoCorrect form, the
'Options' tab.There are two columns of checkboxes: '[M]' for the action to be undertaken when existing text is being modified and '[T]' for the same when you are typing. The fourth line down is 'Automatic *bold* and _underline_' so now is your chance to rid yourself of this formatting 'aid' by unchecking those boxes. You might also want to look at some of the others whilst you are there. |
 Typing can
be enough of a headache without people 'helping' you out.
Typing can
be enough of a headache without people 'helping' you out.
|
||||||||||||||||||||||||||||
 On the right, you can see a simple
illustration of the perception of depth. We all now that
water is deeper than it looks and with the three blocks
on the right, I have given them RIs of 1.60, 2.00 and
2.40. On the right, you can see a simple
illustration of the perception of depth. We all now that
water is deeper than it looks and with the three blocks
on the right, I have given them RIs of 1.60, 2.00 and
2.40.You can see how much the green bar beneath them has been displaced and also, the view of the numbers through the front face and the writing through the top face. We know that we can change the RI in a medium on a ray
traced model so how would we use that to create the
effect of dispersion? |
||||||||||||||||||||||||||||
 On the right, you can see Blender with an
approximation to a simplified brilliant cut gem. On the right, you can see Blender with an
approximation to a simplified brilliant cut gem. |
||||||||||||||||||||||||||||
 On the Mirror Transparency tab, we can
change the Refractive Index (IOR) to whatever we want. On the Mirror Transparency tab, we can
change the Refractive Index (IOR) to whatever we want.So,
what do we want? |
||||||||||||||||||||||||||||
It is convenient to think of the three
primary colours appearing as three wavebands so here are
the values...
Here are the refractive indices of diamond and crown glass at those centre wavelengths...
Now, we can use this data to get the
refractive index of the medium to produce three different
images. |
||||||||||||||||||||||||||||
 Here
are a number of images of the same brilliant(sort of) cut
gem but all with a slightly different refractive index
used. Here
are a number of images of the same brilliant(sort of) cut
gem but all with a slightly different refractive index
used.Click on the image on the right to open up a new browser window with these files in it. You can see that there are slight differences between
the images but if you compare the internal reflections
between dia-222.jpg and dia-224.jpg, you can see quite a
difference. even at this scale. |
||||||||||||||||||||||||||||
 The images are all 800x600 and as I've saved
you the bother of having to create your own diamond model
and render it, you can load them directly into your image
editor. The images are all 800x600 and as I've saved
you the bother of having to create your own diamond model
and render it, you can load them directly into your image
editor.First of all, create a new image that is 800x600 pixels (click on 'File', 'New' the choose a template that is 800x600 then click on 'OK'). You don't have to do this, it is just an easy (lazy) way of accomplishing the task. The advantage is that this gives you an image that hasn't got a name so you won't find yourself overwriting the original. Next, drag the images you want to use (try the dia-240.jpg, dia-242.jpg and dia-244.jpg images (although you can use the dia-222.jpg, dia-232.jpg and dia-242.jpg images to see the effect exaggerated) and drop them on the new images as in the screenshot on the right. You should be able to see the differences between the
images as you drop them onto the image you are creating |
||||||||||||||||||||||||||||
 Here, you can see the effect of exaggerated
changes in refractive index with the value in the top
left. Here, you can see the effect of exaggerated
changes in refractive index with the value in the top
left.If you look carefully, you will see that the
physical dimensions of the gem stay the same - it is the
internal reflections that you see through the faces that
change. |
||||||||||||||||||||||||||||
 Next, in the Layers dialogue box, change the
top two images' mode to 'Addition'. Next, in the Layers dialogue box, change the
top two images' mode to 'Addition'.Now, select the the curves tool and then for each layer, turn down the two colours that aren't wanted. So, for the lowest refractive index image, drag the top-right node in the curves graph down to the bottom right for the green and blue channels so that you are left with the red. Repeat this for the other two layers so that you end
up with a green and a blue image adding to the red - in
the screenshot on the right, you can see the job almost
complete with the mouse to release the node for the green
layer. |
||||||||||||||||||||||||||||
 This
is the final image. If you click on it, the full-sized
image will open up in a new window. This
is the final image. If you click on it, the full-sized
image will open up in a new window. |
||||||||||||||||||||||||||||
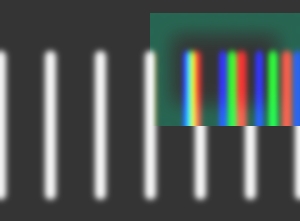
 Here is a part of it blown up. Here is a part of it blown up.You can see that where there is a change in contrast, there are colour fringes. The ones at the top are fairly realistic. However, the darker ones at the bottom show distinct bands - unlike reality. This is why ... |
||||||||||||||||||||||||||||
 When real light (continuous spectrum, such
as tungsten or sunlight sources) is dispersed, you get a
pattern like the one on the right. When real light (continuous spectrum, such
as tungsten or sunlight sources) is dispersed, you get a
pattern like the one on the right. |
||||||||||||||||||||||||||||
 However, we are using just three colours and
the image will end up like so - as the image above shows. However, we are using just three colours and
the image will end up like so - as the image above shows.If
the dispersion isn't that great, you will get away with
it. However, if it is too great, you will end up as
blocks of posterised colour, ie The reason for this is that the computer only needs three colours to simulate most of the colour that we can see. The colours for the continuous spectrum text above are defined as RGB values as opposed to a wavelength. For most purposes, we get away with it but when it comes to continuous spectra, it falls apart because you are looking at spatial separation. Ray tracers could allow you to define the dispersion of a material and it could work its way through the RI range, working out the colours and adding them to the pixel values but this takes a lot of computing. |
||||||||||||||||||||||||||||
 Just when you though it couldn't get any
worse, have you considered mercury vapour lamps? Just when you though it couldn't get any
worse, have you considered mercury vapour lamps?They produce a spectrum like the one on the right. To look at an image produced by that (or, more appropriately, to take a photograph of a scene illuminated by mercury vapour emission spectra), you would need to process four channels and only one of them is anything like close to one of the colours we use. To take a photograph, you would need filters for those wavelengths and then you would need imaging software that could turn it into RGB so that it could be displayed by our three colour monitors. And then, there are some people with a type of 'colour blindness' where they have a fourth colour receptor in addition to the RGB receptors. And then, there is not account of angle of polarisation - reflections with an incident angle of 45 degrees result in one angle of polarisation being reflected predominantly, whilst the other being refracted predominantly. And then, there are minerals that have two, uniaxial birefringent refractive indices - examples being Calcite, Rutile, Sodium Nitrate and Calomel. Being able to see yellow light as its own colour means that three colour monitors would never look like the real thing because only 75% of the image they require is displayed. It would be a bit like mixing the red and green to make one yellow channel. Penultimately (as opposed to finally), as this happens in all transparent media, including lenses, there are three solutions to the problem of chromatic aberrations in lenses. Essentially, you get chromatic aberrations when you use a convex lens with a medium that produces a higher RI with blue light. So, you can either:
Solution 1 has the effect of lowering the power of the lens, 2 has the effect of increasing it and 3 reflects the light, reversing it which is all right if you are using a telescope or a camera. And finally, how do your eyes correct for chromatic aberration? Well, they don't. You don't have any colour sensitivity in your peripheral vision where you would get chromatic aberrations. Your vision there is only monochrome. You perceive colour in your peripheral vision because your brain makes up what it doesn't know, either from having looked at it recently and assuming that it hasn't changed, or from guess work. |
||||||||||||||||||||||||||||
 On the
right, you can see that pulses of light (a mixture of
monochromatic red, green and blue, as opposed to a
continuous spectrum) travelling from left to right are
slowed down by the medium. Different colours are slowed
down by different amounts. It is usually the blue that is
slowed down the most but not in all materials.
On the
right, you can see that pulses of light (a mixture of
monochromatic red, green and blue, as opposed to a
continuous spectrum) travelling from left to right are
slowed down by the medium. Different colours are slowed
down by different amounts. It is usually the blue that is
slowed down the most but not in all materials.Extend your WiFi range
There isn't actually a limit beyond where the waves won't travel. They will, go on forever. However, there is an effective limit, the limit of a usably high signal level. In the diagram on the left, both A and B are within each other's usable signal levels. You could increase this range so that your signal could be received over a larger range by increasing the power but whilst your signal could be received, you would need a more sensitive receiver in order to be able to receive other user's signals. However, there is another way of doing this... |
 Several years ago, there was a demonstration
just before the annual InfoSecurity exhibition in London
(UK). They got a normal Bluetooth dongle (remember that
one of the main security features of this is that it has
a range of only 5 to 10m) and a wave guide (making it
look like a Bazooka) and were able to transmit/receive
signals of a ranged between half and one mile. Several years ago, there was a demonstration
just before the annual InfoSecurity exhibition in London
(UK). They got a normal Bluetooth dongle (remember that
one of the main security features of this is that it has
a range of only 5 to 10m) and a wave guide (making it
look like a Bazooka) and were able to transmit/receive
signals of a ranged between half and one mile.This is
effectively what is happening in the diagram on the left.
C's footprint has been changed by using a
reflector/waveguide and whilst A and B were secure(ish)
before C turned up, they can now be hacked. |
 Wireless routers are effectively increasing
their coverage because of the use of wireless network
range extenders. These are simple devices that once
configured, extend the range of a network to several
hundred yards and also fill in any dead spots you might
have had. Wireless routers are effectively increasing
their coverage because of the use of wireless network
range extenders. These are simple devices that once
configured, extend the range of a network to several
hundred yards and also fill in any dead spots you might
have had.They can also be used as wireless access points, allowing you (and possibly a number of other people) to benefit from the freedom of your network. In addition, some gadgets can increase the range of a network up to several miles. In the diagram on the left, you can see that even using one that has the same strength/sensitivity as the original network, there is now an effective area D that has coverage of anything that C can pick up and transmit to. Many companies assumed that because their network used to have a range limited to their building, they didn't have to do anything about security other than use the default passwords. As a result, these companies are now becoming vulnerable. So, how do we make it safer if we are going to stick with wireless? Passwords need to be changed and encryption used, even on guests. With a 802.11g WiFi router with a claimed line-of-sight range of up to five miles on the market so you can't make any assumptions any more. So, Extend your WiFi range but remember that you could be extending other people's. WiFi has never been completely safe but now it needs security like it has never needed it before. |
 With a
wireless router, you are all right as long as all of your
nodes are effectively out of range by the perimeter of
your property - this can either be because you property
is so big or because your buildings cut down the range so
that it stays effectively within your site.
With a
wireless router, you are all right as long as all of your
nodes are effectively out of range by the perimeter of
your property - this can either be because you property
is so big or because your buildings cut down the range so
that it stays effectively within your site.
|
|
 One alternative is
nmap but you can't see what is going on quickly and it is
not cross-platform. It's output is displayed in the
screenshot on the right. One alternative is
nmap but you can't see what is going on quickly and it is
not cross-platform. It's output is displayed in the
screenshot on the right.It scans the network that you've specified and tells you about anything that it's found. To see what's going on, you have to take the trouble to execute it - it's not automatic - and read it. Where Nagios could have been too much, this is
probably too little. |
|
 Further up the page
(Preloading pings for quicker results), we saw how you
can send and receive up to 3 pings in a few milliseconds
without any additional privileges. Further up the page
(Preloading pings for quicker results), we saw how you
can send and receive up to 3 pings in a few milliseconds
without any additional privileges.Round-trip times are printed out in milliseconds to three places (here, they all have three microseconds as the last place but that is just coincidence) so resolution is down to microsecond level (the clock on a 100mb/s Ethernet runs at 25MHz so 1 microsecond is well within its abilities). |
|
| If we sniff the
network when this is done, you can see that the actual
time between pings is in the order of six to thirty
microseconds so it does the job fairly easily and with a
useful resolution. |
|
 So, I've provided you
with a little program I've written that displays a
dialogue box showing you the status of any IP addresses
you need to monitor so you can see what is going on at a
glance. So, I've provided you
with a little program I've written that displays a
dialogue box showing you the status of any IP addresses
you need to monitor so you can see what is going on at a
glance.Just click on any block to give you an immediate update or wait for the program to do it itself. You can get it to display the name and/or the IP
address of the machine along with its ping time in
microseconds. |
|
 |
 IP groups, intervals and warning thresholds
are all defined in the configuration file making the
addition of new machines simple. IP groups, intervals and warning thresholds
are all defined in the configuration file making the
addition of new machines simple.You can make the warning limits different for each IP address so whilst a local machine might show red for a ping of 150 microseconds, one on a distant network could show green at 20,000 microseconds. The program is written in Perl, is annotated and runs on Windows, Linux and the BSDs so it is easy to edit and being a flat text file, you can even edit it in Notepad. Above-right is the program running on Linux and on the right, it is running on Windows Vista. *Note that on Windows, the ping resolution is only in whole milliseconds so, for your LAN, where ping times are usually only a few hundred microseconds, they will show up as zero. |
 You can make the non-okay IPs stand out more
by making the green colour only slightly different to the
form's colour. I fact, you don't need to use green,
yellow, orange and red at all if you don't want to -
these are all fully configurable in the program. You can make the non-okay IPs stand out more
by making the green colour only slightly different to the
form's colour. I fact, you don't need to use green,
yellow, orange and red at all if you don't want to -
these are all fully configurable in the program.On the left, you can see one configuration that I use - I'll leave it as an exercise for the reader to modify the program so that it produces the output on the left. You can find the program and the configuration file by
clicking here
for Windows and here for Linux, *BSD and so on which
will open up a new browser window. The OS is specified in
the configuration file and if you want to add another
(such as Solaris), just add it to the configuration file
and the program - it is fairly obvious how to. |
|
 When you run the program, it checks through
the configuration file and lets you know what is going
on. When it exits, it leaves a code which is... When you run the program, it checks through
the configuration file and lets you know what is going
on. When it exits, it leaves a code which is...
|
|
 Monitor Live IP
Status
Monitor Live IP
Status
|
||||||||||||||||
 If, you want to change the highlighting (for
some reason or if it hasn't decided that it is a PS file
(for instance, you haven't saved it yet), then just click
on 'Tools', 'Highlighting', 'Markup', 'PostScript' to
select the highlighting. If, you want to change the highlighting (for
some reason or if it hasn't decided that it is a PS file
(for instance, you haven't saved it yet), then just click
on 'Tools', 'Highlighting', 'Markup', 'PostScript' to
select the highlighting.So, whilst all PostScript files start off with '%!PS-Adobe' on the first line, they don't have to on every system - the percent sign is used as a remark so it is ignored by the interpreter any way. However, it is a good idea to use it if you want your
files to be cross-platform. |
||||||||||||||||
 First of all, start off your file so that it
looks like this... First of all, start off your file so that it
looks like this...%!PS-Adobe showpage ...and save it, for example, as 'myfile.ps'. The showpage command makes the interpreter display the page so it is fairly important to have it there. All of the other programming goes between these two lines. (Note that line endings are not important to the interpreter. There are no semicolons or commas, just white space. Use it to make your document legible.) However, now that it is saved, you can open it with a viewer such as KGhostView. If you have saved your file to the desktop,
right-click on the file and select 'Open With',
'KGhostView'. The program will look like the screenshot
on the right. To get the paper size right, click on
'View', 'Paper Size', 'A4'. |
||||||||||||||||
 Each time you modify the page as you program
it, can refresh the image of it by switching focus to
KGhostView, pressing [F5] and then switching focus back -
ie, pressing [Alt]-[Tab], [F5], [Alt]-[Tab], which is a
bit laborious. Each time you modify the page as you program
it, can refresh the image of it by switching focus to
KGhostView, pressing [F5] and then switching focus back -
ie, pressing [Alt]-[Tab], [F5], [Alt]-[Tab], which is a
bit laborious.Instead, on KGhostView, select 'Settings', 'Watch File' and whenever you save your PS file, it will update the image of it automatically. So, we have the first line and the last line, now we need to put something in between. Here are some of the basics... First of all, the co-ordinate system works with 0,0 in the bottom left with 'y' increasing as you move up the paper (just like it does on graph paper, except that we all got used to it being 0,0 at the top left with 'y' increasing as you move down the paper when we all learned how to do graphics on the computer - just forget everything you know about computer graphics). The distance units you will be using are an
approximation to points. One of these points is 1/72nd
of an inch or 28.34 units to the centimetre. For
argument's sake we will acknowledge that they are not
actually real points but go ahead and call them points
any way. |
||||||||||||||||
Next, the commands are designed to work
with a stack (a 'LIFO' buffer, the Last
one you put In
is the First
one to take Out).
31 15 mul ... and it removes the 15 and 31 places 465 on the stack. Note that the height of the stack has gone down one. Also remember that in our .PS document there are no commas, just white space between the values. If you want to move the pen from 20,20 and draw a 1.6 point wide line to 40,50, you write this... %!PS-Adobe 1.6 setlinewidth 20 20 moveto 40 50 lineto stroke showpage Highlight the text above and copy it [Ctrl][C]. In KWrite, Select all text [Ctrl][A] and paste the new text [Ctrl][V] and then save it [Ctrl][S]. You can do this with any of the text here that starts and finishes properly (ie with the adobe first line and showpage). When you save the file, KGhostView updates its display and you can see what you have just done. Note that if you wanted to move the line upwards so that instead of starting at 20,20, it started at 20,80 and wrote ... 80 20 moveto 40 50 lineto ... you would end up with a line that pointed downwards - you would have to change the y co-ordinate of the second line as well so that it read 40 110 lineto. Instead, you can make life easier by using relative co-ordinates. You do this by using rlineto and rmoveto instead. If your first lines look like this ... 20 20 moveto 20 30 rlineto ... then for your second pair of lines, you only need to change the absolute co-ordinates like so ... 80 20 moveto 20 30 rlineto ... which gives the same results. So, always start off with a pair of absolute co-ordinates. So, let's start off with a Scotch Border. We'll bracket the contents of our page with two commands that preserve the rest of what is going on, on the printer - these are called gsave and grestore. Additionally, we'll define the colour in terms of RGB and the line width in points. 'setrgbcolor' is spelled the Americanised English way so there is no 'U' in it and the other thing to look out for is that the RGB values have a value from 0 to 1 inclusive (you don't have to remember if it was (0..100) or (0..255) or whatever). The value of the line width is in points and the line between the line's starting and ending points defines the line's centre-line. This means that if you want to place things by the side of lines, you have to take this into account (but you'll be using a computer so that shouldn't be hard to do, you just have to remember to do it). We'll also add the concept of a path - this allows you to define a starting point and when you want to close it, instead of having to work out just how you should get back (you might have been using different co-ordinate systems or something) all you have to do is close the path and it does it for you. It also has another effect. Try running the following program (The % at the beginning of each comment on the right, above, allows you to copy the text just by dragging it into a text editor - the % signs making the column on the right into comments which won't be interpreted so you don't need to be concerned about deleting it because you don't need to.)...
So this is what we have so far... %!PS-Adobe
gsave
% draw scotch border
0 0 0 setrgbcolor 0.5 setlinewidth
newpath
50 50 moveto 50 790 lineto
550 790 lineto 550 50 lineto
closepath
stroke
2 setlinewidth
newpath
53 53 moveto 53 787 lineto
547 787 lineto 547 53 lineto
closepath
stroke
grestore
showpage
Copy and paste this into a new document to see it work. You can insert an additional rgb definition before the second line and make the two lines different shades of grey or any other colour if you want. Another option is that instead of feeding the stack just the values it needs when they are needed (ie, for a moveto, you push two values onto the stack), you can push as many values as you like onto the stack and then execute them with a series of commands. Instead of having ... 50 50 moveto 50 790 lineto 550 790 lineto 550 50 lineto ... you have ... 550 50 550 790 50 790 50 50 moveto lineto lineto lineto However, it is important that you remember the order that they are read off the stack. If we colour each set of values and instructions, the order they go in is this ... 550 50 550 790 50 790 50 50 moveto lineto lineto lineto The commands remove numbers from the top of the stack so they take them off in the reverse (pair) order that you put them on (note that this is not all numbers in reversed order, just the pairs as they are used - if you used commands that took different numbers of values such as 'setrgbcolor' or 'setlinewidth', you would group those instead) So, whilst that might look pretty, it is hard to read so what use it is? Well, you can define your own procedures (do this by putting a slash in front of the name, then open and close braces then 'def' and your procedure goes inside the braces like '/l {lineto} def' ). Note that these are case-dependent so 'p' is different to 'P'. If you do something more than once or twice (depending upon how long it is and how lazy a typist you are), you can turn it into a procedure. Instead of 'moveto lineto lineto lineto', you could just define a procedure. In fact, the other things we used to define a box don't even use parameters so we could end up with this... %!PS-Adobe
/b {newpath moveto lineto lineto lineto closepath stroke} def
gsave
% draw scotch border
0 0 0 setrgbcolor 0.5 setlinewidth
550 50 550 790 50 790 50 50 b
2 setlinewidth
547 53 547 787 53 787 53 53 b
grestore
showpage
... where the co-ordinates of the box are all pushed onto the stack in reverse-pair order and then 'b' is called which pops them all off again so our stack is clean. Note that your procedures don't have to be single line, they can call each other (be careful) and you can put comments in them so that you can maintain your program (if you make an original and comment that, when you write your program, you can leave the comments out of its output - you don't need them there). Also, your procedures can have any names they want (within the usual limits) but remember that they are case-dependent though. Let's put some text at the top. A font is just a PostScript file and you find it, scale it and then set it to be the current font. Like any drawing, you take a position and then start drawing. Like so ... %!PS-Adobe /Helvetica findfont 36 scalefont setfont 65 750 moveto 1 0 0 setrgbcolor (PC) show 0 0 0 setrgbcolor (Plus HelpDesk SuperDVD) show showpage ... where the font is Helvetica, it will be 36 points high, positioned at x=65 points and y=750 points. Using a red colour (1,0,0), we print the letters 'PC'. The current position is now after the 'C' of 'PC' Next, we change the colour to black and print the rest of the text.
%!PS-Adobe
gsave
  /Helvetica findfont 36 scalefont setfont
  65 750 moveto
  1 0 0 setrgbcolor (PC) show
  0 0 0 setrgbcolor (Plus HelpDesk SuperDVD) show
  /Helvetica-bold findfont 36 scalefont setfont
  55 700 moveto
  1 0 0 setrgbcolor (PC) show
  0 0 0 setrgbcolor (Plus HelpDesk SuperDVD) show
grestore
showpage
Supposing you get your design all nice but decide that it could all move about an inch to the right and half an inch upwards. Instead of changing all of the absolute co-ordinates, all we need to do is introduce a vector function. 72 36 translate This takes the current co-ordinate system and shifts it all along and upwards by the defined amounts. Note that this is relative so the next one you use adds to this so if you wanted to shift the next load of actions left by half an inch after using the command above, you would use ... -36 0 translate Another thing you can do is to write for-to-next loops. You define: the starting value; the increment; the value that, when exceeded, will cause the anonymous procedure to not run; the anonymous procedure; and, type the word 'for'. If you wrote ... %!PS-Adobe
/Helvetica findfont 72 scalefont setfont
50 750 moveto % Put it at the top of the page
0 5 50 {
dup % Make a copy of the number on the stack
0 rmoveto % Use that top copy and add a 0 to it to
% get an increasing movement to the right
50 div dup 0 exch setrgbcolor % Push a 50 onto the
% stack and divide the number on the stack
% by it so we have a number from 0 to 1.
% Duplicate it, push a zero onto the stack,
% swap the zero with the number under it (Okay,
% this is totally unnecessary but it shows
% you that it can be done, then use the three
% values to set the rgb colour with '0' in
% the middle so we get shades of magenta
(I) show % Print an 'I' which, in Helvetica is just
% a vertical bar
} for
showpage
|
||||||||||||||||
The next snippet uses what we have
already learned plus the rotate command which takes the
value off the stack (in degrees) and rotates about the
current location, everything you do after it. It is
sensible to use gsave and grestore when doing this. Note
that we also use an rmoveto with a negative Y value. The
font height is  12 points should give you a clue as to why
we do this. Try changing it and see what happens. 12 points should give you a clue as to why
we do this. Try changing it and see what happens.% upper arc of PC Plus
/Helvetica findfont 12 scalefont setfont
0 11.25 90 {
gsave
0 100 moveto
rotate
50 -6 rmoveto
1 0 0 setrgbcolor (PC) show
0 0 0 setrgbcolor (Plus ) show
1 0 0 setrgbcolor (PC) show
0 0 0 setrgbcolor (Plus) show
grestore
} for
Note that I have used indentation to make it easier
for me to track what is going on - the machine doesn't
have any trouble unless I make a mistake. |
||||||||||||||||
 Finally, the colour blocks look like this
... Finally, the colour blocks look like this
...%!PS-Adobe
50 50 translate
0 20 100 {
dup dup 0 moveto
0 20 100 {
exch 100 div exch 100 div 0 20 rmoveto
1 setrgbcolor 20 setlinewidth
gsave
0 20 rlineto stroke
grestore
dup
} for
pop
} for
showpage
We've already used or commented on all of the commands here so see if you can work out how it works.
The best way of doing this is to open up a text editor
and pretend to be the stack |
||||||||||||||||
 Here is another one for you to look at.... Here is another one for you to look at....%!PS-Adobe
150 550 translate
% Graded border
10 setlinewidth
gsave
1 1 8 {
dup
8 div dup 2 div 0.5 add
exch dup 2 div setrgbcolor
-10 -10 translate
newpath
0 0 moveto dup 20 mul 0 rlineto
dup 20 mul 0 exch rlineto
dup -20 mul 0 rlineto
closepath
stroke
pop
} for
grestore
% Orange diamond
1 0.5 0 setrgbcolor
newpath
-10 0 moveto 10 10 rlineto
10 -10 rlineto -10 -10 rlineto
closepath fill
showpage
Again, pretend to be the stack to see what is going on. |
||||||||||||||||
 There are programs that will produce PS or
EPS output that you can look at such as Karbon14. There are programs that will produce PS or
EPS output that you can look at such as Karbon14.These are like any other vector drawing program (they will also produce other file types as well such as BMP, PNG GIMP Native Image Format, Windows Metafile and so on) and when outputting to EPS, you can open them up with a text editor like any other type of PS file. One thing you won't see is fonts defined as they are all converted to linetos. Once you have learned the tricks you need to know, converting the file into the program you need to generate it is simple - you know what you want, you know what you need and you know how to do it. Using one of your own programs to write these files is also very powerful - if you write your own Sudoku or Kakuro problem generating program for example. |
 Standardise your
document program output
Standardise your
document program output So if you
want to multiply 31 by 15, you write ...
So if you
want to multiply 31 by 15, you write ...


 ... and
you should get the result above on the right. Each of the
images is next to their subroutines so you can see what
happens.
... and
you should get the result above on the right. Each of the
images is next to their subroutines so you can see what
happens. Just in
case you were wondering, if you want a bold font, you ask
for one. It doesn't convert a font that you haven't got a
bold version of into a bold font but if you have one, it
will use it. Try the following fragment ...
Just in
case you were wondering, if you want a bold font, you ask
for one. It doesn't convert a font that you haven't got a
bold version of into a bold font but if you have one, it
will use it. Try the following fragment ... ... then we
get a series of capital 'I's in 72 point Helvetica
running from the top left of the page in black through to
the right hand side with increasing spacing and
increasing 'magentaness' like so.
... then we
get a series of capital 'I's in 72 point Helvetica
running from the top left of the page in black through to
the right hand side with increasing spacing and
increasing 'magentaness' like so.Using a pipe
You could have each program open up the RS232c link, talk to it and then close the port but supposing something went wrong - would your web counter (and therefore your webserver) gum up? Also, what if you wanted your webcounter value displayed for 2 seconds before anything else was shown (apart from another webcounter update of course)? This latter condition might be difficult to control using files to pass data onto a program that read them continuously - a lot of file reading going on there ... Ideally, we want all of the programs to talk to a
continuously running program, through a single point of
entry, so that it can all be controlled intelligently.
This is one way of doing it. |
| There are a number of different file
types on a UNIX-like system and one of the more
interesting and useful is the 'pipe'. A pipe is a FIFO
buffer that has permissions in the same way as any other
file does. A program sitting on the receiving end of it
can process data when it comes in instead of having to
read a file every second or so. This is far more
efficient.
mkfifo webctr ... which will create a pipe called 'webctr'. This has permissions which can be changed if you need to - you should need to write to it for a start. You might find that it is owned by root so if you chown it to yourself and then change the permissions to -rw--w--w- or 644 then you can design it so that anything can write to it but only you can read it (later on, you can make it so that the owner has little in the way of privileges and run it as that). So, we need a program that can read from the pipe and
any number of programs that can write to it. The best
language to handle this is Perl - it is on all UNIX-like
systems by default (the Internet runs on Perl) and it is
designed for the job. |
 I have written some
example code for you which should demonstrate how it
works and you can get to the directory by clicking here.
Unfortunately, pipes can't be copied onto DVDs because
they won't go into .ZIP or .TAR.GZ files so you will have
to make your own in the directory that you copy these
files into. These files just demonstrate how you can have
several files talking to another program via a pipe and
they can be filtered so that the appropriate information
gets to the device. You can edit them to make them as
simple or complicated as you like. I have written some
example code for you which should demonstrate how it
works and you can get to the directory by clicking here.
Unfortunately, pipes can't be copied onto DVDs because
they won't go into .ZIP or .TAR.GZ files so you will have
to make your own in the directory that you copy these
files into. These files just demonstrate how you can have
several files talking to another program via a pipe and
they can be filtered so that the appropriate information
gets to the device. You can edit them to make them as
simple or complicated as you like.The important file
is the 'cntiface' file which acts as the interface
between your pipe and your display. You display should
either be able to take digits or any character and there
will be control characters as well. All you need to do is
to make sure that the control characters are sent in the
string with your information. |
 The output program works by sending its data
to the console output so it is seen as a series of lines.
The actual counter will be different, of course. The output program works by sending its data
to the console output so it is seen as a series of lines.
The actual counter will be different, of course.The
variable $digitonly is set to 0 to get the verbose
(LCD-type) display and, |
If you open a console, cd to your pipe directory and type ./cntiface nothing will happen until something is sent to the pipe. Let it run for the moment... More on this program later. |
 Let's have a look at the inputting programs. Let's have a look at the inputting programs.This
As this program already has the number in it, you can just add the three lines that start with 'open' and finish with 'close'. If you process your web counter value by, say, putting commas between groups of three digits (in the style of thousands, ie 1,234,567) then you can either make a copy of the counter value or take the processed value and remove the commas using the substitute string ( $c =~ s/,//g; ). At the end of the program, use the lines ... open (PIPE, "+<webctr") or die $!; print PIPE "cn $c\n"; close PIPE; as the last thing it does before the program exits. That way, if there was any problem with opening the pipe, it would not destroy the functionality of the rest of the counter cgi script and any error would show up in the server's error log. Using '+<' in the open statement means that it will not hang up if the pipe has nothing listening to it so your web server won't time-out. If nothing is there, nothing is heard but, like the tree falling in the woods, it carries on happening any way. Open up another console, cd to your pipe directory and
type ./inp1 and it will start sending a counter signal
('cn 128934' to start with) between every 2 to 5 seconds.
Let it run. You should see the printer number appear in
the other console. |
 The other program really just demonstrates
that you can have more than one program writing to it at
the same time and that the input from one program is
processed to have priority over the input from the other. The other program really just demonstrates
that you can have more than one program writing to it at
the same time and that the input from one program is
processed to have priority over the input from the other.This one, just for the sake of producing data, sends the uptime of the computer every second to the pipe. In reality, if you wanted to use uptime, you would get the program that reads the pipe to look at it using an alarm interrupt. Back to the program that listens to the pipe and talks
to the display device. |
| Once you have started this program, it
only runs when something is written to the pipe (unless
you are using an alarm as well, such as in the uptime
option). You would normally start the program by opening the port to the display device and end the program by closing it. However, here, I'm not assuming that you have such a device so that is remarked out. The next thing that happens is that the pipe is opened (again, this is closed at the end) and the piped monitored - this goes to $_ when it arrives. This has the carriage return chomped off and then it is split into two - the function and the value. $a =~ m/(..) (.+)/;
$fn = $1;
$val = $2;
We use a matching regular expression to get the first two characters, ignore the space and then get the rest of the string. If you look at the other two programs, they start their output with either a 'cn' or a 'ut'. Here, we use that information to determine what we should do. You don't have to do it this way - you could use just the numbers but here, we are making the program more flexible for future changes should they be needed. The next few lines look to see if it is an uptime and if it is, then if the last information displayed was within 3 seconds, it does nothing. There is provision for an old function ($of) so that you could, if you wish, get it to compare that and if the last command was an uptime, print it out anyway. Next, it looks to see if it is a counter value. } elsif ($fn eq "cn") {
if ($digitonly == 0) {
1 while ($val =~ s/(\d+)(\d\d\d)/$1,$2/);
printit "Web Counter: $val";
} else {
printit "$val";
}
If it isn't digit only, the string is broken with commas at every third digit from the right and then the words 'Web Counter: ' is added so '1234567' would turn into 'Web Counter: 1,234,567'. If it is digit only, then it is left as just the number. In both cases, the value is sent to a routine called 'printit'. Here it just outputs to the console screen - where you would add any control codes you need to use. sub printit {
$a = shift;
# here we put our program for writing to the port
# note that the port is already open so we don't
# have to do that
# until then, we'll write to the screen instead
print "$a\n"
}
This is just a demonstration. You can add whatever
functionality and connectivity you like. |
 Also in the files
directory is a GUI version (for those of you who haven't
got the Nixie or LCD hardware but want to have a counter
on the screen) called 'cntGUI'. When it's running, put it
on top and make it visible on all desktops. Also in the files
directory is a GUI version (for those of you who haven't
got the Nixie or LCD hardware but want to have a counter
on the screen) called 'cntGUI'. When it's running, put it
on top and make it visible on all desktops.For the reason that anybody can read the pipe, you don't need a privileged user to be able to. So, you can have this program in your ~/home/bin/perl/ directory if you want and run it from there. Just make sure that the path to the pipe is correct - use and absolute path. On the right is the real output from that particular program - adapt it how you want to. In addition, this one sends a "\a" to STDOUT which is the standard VT100 bell so if you are running it from a console, you will get a beep each time someone looks at your main page. (Leave this on a line on its own so that it is easy to see and remark out because eventually, it will drive you around the bend.) If you want to make more than one program look at the result of the counter increment, you could make your other program save its PID to a file in a known place and then program your pipe-monitoring program to read that and send the pid a signal (assuming that it is with the same user or is root - privileges making security in UNIX again) so that the program receiving the signal can read the new value in the counter number file. |
 However,
they all need something to process the data that the web
counter passes on. Ideally, a number of different
programs would talk to it and it would all be under a
semi-intelligent control - sort-of.
However,
they all need something to process the data that the web
counter passes on. Ideally, a number of different
programs would talk to it and it would all be under a
semi-intelligent control - sort-of. You have a choice of commands to create them
(depending on your system), either mkpipe or mkfifo. To
make a pipe in the current directory, type ...
You have a choice of commands to create them
(depending on your system), either mkpipe or mkfifo. To
make a pipe in the current directory, type ...