PC Plus HelpDesk - issue 228
This month, Paul Grosse gives you more insight into
some of the topics dealt with in HelpDesk and HelpDesk
Extra
|
 |
HelpDesk
Image File Options
|


HelpDesk Extra
Nagios - Background
The program itself monitors system resources by testing them at specified time intervals. You can define your own working week with different days, hours and so on so, if you have a POETS day, machines that are only turned on during office hours but with an early finish on Fridays, that could be defined so that it would know not to look for it out of the specified hours. If something out of the ordinary happens such as a machine becomes unreachable for more than a specified amount of time, Nagios can email you or perform one or more of a variety of functions as specified by you in the configuration files - such an event could be triggered by a system crash, a hardware failure such as a NIC going down, workmen cutting through a fibre-optic cable or somebody stealing a server; and you would know either in real time or by looking at the logs when it happened. Nagios not only looks at the machines on your network, but also at other resources so if, for example, you have an outsourced website that you need to know is available 168/52, Nagios can check it for you and let you know if it was unavailable on Saturday evening. When you install Nagios, and then look at the configuration and help files (/etc/nagios) you might find that the paths are slightly different to some of the various Nagios resources on the system. On SuSE Linux, the webserver root (that is placed in Apache's server file system using aliases) is on /usr/lib/nagios; the documentation and other resources are on /usr/share/nagios; and; the log files are on /var/log/nagios. When configuring Nagios, the log files very useful as they will let you know where you have gone wrong (unless you manage to configure it correctly the first time you use it). There are two main parts to configure:
|
 This program runs on
one of the machines on your network, monitoring it
continuously. It is better to have it running on a
machine on its own if you are monitoring a large network
of thousands of machines but for a small network of
around a dozen machines, a server as modest as a 500MHz
machine with a few hundred MB of RAM will work all right
with other things running on it..
This program runs on
one of the machines on your network, monitoring it
continuously. It is better to have it running on a
machine on its own if you are monitoring a large network
of thousands of machines but for a small network of
around a dozen machines, a server as modest as a 500MHz
machine with a few hundred MB of RAM will work all right
with other things running on it..Configuring ApacheLook in Apache's configuration file - httpd.conf in /etc/httpd and in the aliases section, you need to let Apache know that Nagios is to be a part of the system and what it is going to be called... Aliases section## start of nagios inclusion ScriptAlias /nagios/cgi-bin/ /usr/lib/nagios/cgi/ <Directory /usr/lib/nagios/cgi/> Options ExecCGI AllowOverride AuthConfig AuthType Basic AuthName "Nagios Access" AuthUserFile /etc/httpd/pswds AuthGroupFile /etc/httpd/gps Require group nagiosgp Satisfy Any order deny,allow deny from all </Directory> Alias /nagios/ /usr/share/nagios/ <Directory /usr/share/nagios/> Options None AllowOverride AuthConfig AuthType Basic AuthName "Nagios Access" AuthUserFile /etc/httpd/pswds AuthGroupFile /etc/httpd/gps Require group nagiosgp Satisfy Any order deny,allow deny from all </Directory> ## end of nagios inclusion You also need to make an addition to the directories so that Apache knows who is allowed to use it. Access permissions section## start of nagios inclusion <Directory /usr/lib/nagios/cgi> AllowOverride AuthConfig AuthType Basic AuthName "Nagios Access" AuthUserFile /etc/httpd/pswds AuthGroupFile /etc/httpd/gps Require group nagiosgp Satisfy Any order allow,deny allow from all Options ExecCGI </Directory> <Directory /usr/share/nagios> AllowOverride AuthConfig AuthType Basic AuthName "Nagios Access" AuthUserFile /etc/httpd/pswds AuthGroupFile /etc/httpd/gps Require group nagiosgp Satisfy Any order allow,deny allow from all </Directory> ## end of nagios inclusion This might seem a bit belt-and-braces but it doesn't leave anything to chance. With the conf file updated you can restart Apache using YaST2. |
Hierarchy
The diagram on the right (click on it to open up a larger version in a new window) shows how you can group hosts into areas and have different groups of people looking after them. |
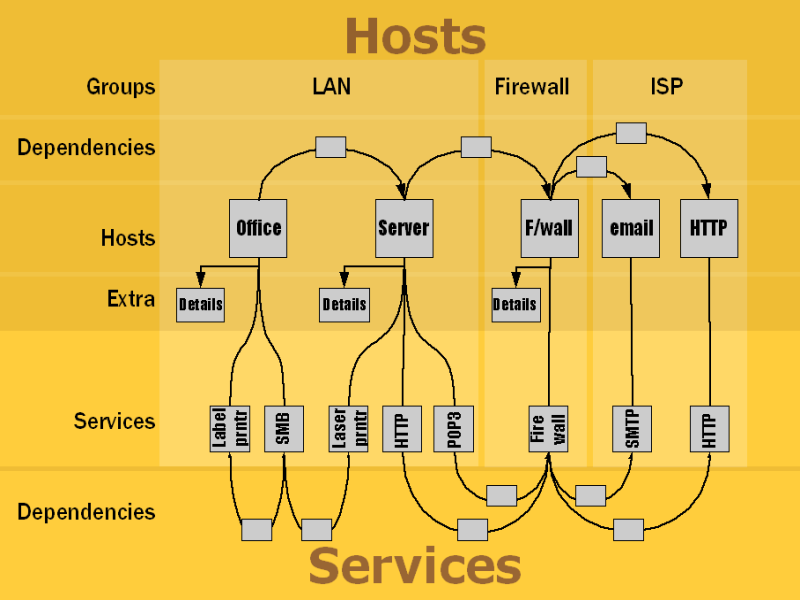
Configuration FilesThe other bit you have to configure is Nagios. This is broken down into a number of files in a sort of relational database thus... cgi.cfg checkcommands.cfg command.cfg contactgroups.cfg contacts.cfg dependencies.cfg escalations.cfg hostextinfo.cfg hostgroups.cfg hosts.cfg misccommands.cfg nagios.cfg nrpe.cfg nsca.cfg original_cfgs resource.cfg send_nsca.cfg services.cfg timeperiods.cfg The main configuration of Nagios is in nagios.cfg where the program is told where to look for the resources that it needs; each host has a place in the hosts.cfg and each host is part of a group (these can be which subnet they are on and so on) which are mentioned in hostgroups.cfg. Hosts are dependent upon the services of other hosts and so on - the whole lot linking together. The contacts (people such as systems administrators on various shifts and so no) are members of contact groups and can be (individually) contacted according to their work times. In addition to this, it is possible to specify scheduled downtime so that people are not getting warnings about things that are not really happening. Details of the configuration files are in HelpDesk Extra in this month's magazine. The best way of getting to know Nagios is to set up a simple network with just a few hosts and a few services (say, just pings to start with and perhaps a http server). Configure it and then start Nagios in YaST2. If anything is wrong, the error log (config.err in /var/log/nagios) will tell you what it is (or at least the first ones it comes across until things get so confusing that it just gives up - things have to be fairly bad for this to happen though and it usually does a good job of letting you know what it wrong). Once it is up and running, you can access it via a web browser on any machine that you have so permitted. You will have to type your userID and password and then you are in. Click on Tactical Overview and you will be able to see at a glance if there is anything wrong with hosts or services. |
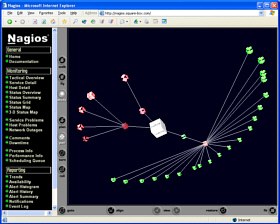
Graphical Output
If you want to keep an eye on your ISP, this is an
ideal way of doing it as it gives you historical data
that you can zoom in on, locating transitions from one
state to another, down to the second if necessary. The locations of the hosts in the image are determined
by the configuration files in the 2D section for each
host. The little man with the shovel indicates that the
problem has been acknowledged and the speech bubbles
indicate a comment that has been logged. |
 This screen shows
that there has been a series of failures on one of the
hosts (checked by using Ping).
This screen shows
that there has been a series of failures on one of the
hosts (checked by using Ping). This screen shows the
systematic layout of the network. For each of the hosts,
there is a symbol that indicates the operating system of
the machine or some other aspect of it. You can download
these images from the Nagios website.
This screen shows the
systematic layout of the network. For each of the hosts,
there is a symbol that indicates the operating system of
the machine or some other aspect of it. You can download
these images from the Nagios website. This screen shows the
status of the hosts, along with details about messages
and so on. If Nagios decides that the status of a service
or host is flapping (alternating between up and down
repeatedly) you will see that here as well.
This screen shows the
status of the hosts, along with details about messages
and so on. If Nagios decides that the status of a service
or host is flapping (alternating between up and down
repeatedly) you will see that here as well. This shows an ISP's
gateway under stress. The data that makes up this image
was collected for over 6 months and shows that the users
put the system under significantly more stress un the
evening as you might expect.
This shows an ISP's
gateway under stress. The data that makes up this image
was collected for over 6 months and shows that the users
put the system under significantly more stress un the
evening as you might expect.Running example
|
 If you want to see
Nagios running on a site and have a play around with it,
go to
If you want to see
Nagios running on a site and have a play around with it,
go to