PC Plus HelpDesk - issue 237
This month, Paul Grosse gives you more insight into
some of the topics dealt with in HelpDesk
|
 |
HelpDesk
Local Area Network IP ranges - RFC 1918There has been talk for a long time of IP addresses running out and as the number computers increases, there are fewer and fewer to go around. Certainly, if you have a large network and only a few of those machines need to have Internet access, there is no need for the other to have it as well as those IP numbers would be wasted - there are only 4294967296 (minus a certain amount to make it all work). Nowadays, we have a gateway computer through which all Internet traffic passes with any machines that do not need access, not taking an external IP number. However, the gateways need to know whether an address is an internal or external and there needs to be an address space that the internal network can use regardless of its size (within reason). As a result, the Internet Assigned Numbers Authority (IANA) has reserved the following three blocks of the IP address space for private intranets: 10.0.0.0 - 10.255.255.255 (10.0.0.0 netmask 255.0.0.0) 172.16.0.0 - 172.31.255.255 (172.16.0.0 netmask 255.240.0.0) 192.168.0.0 - 192.168.255.255 (192.168.0.0 netmask 255.255.0.0) Normally these are used as the old class 'A', 'B' and 'C' sized networks so you would have 10.0.0.0 - 10.255.255.255 (one network of 10.0.0.0 netmask 255.0.0.0) 172.16.0.0 - 172.31.255.255 (32 networks from 172.16.0.0 to 172.31.0.0 netmask 255.255.0.0) 192.168.0.0 - 192.168.255.255 (256 networks from 192.168.0.0 to 192.168.255.0 netmask 255.255.255.0) Although there is nothing to stop you from using 10.12.51.0 to 10.12.51.255 with a netmask of 255.255.255.0 because your router/gateway will know that as it starts with 10, it is internal and so on. If you accidentally transpose two of these digits, you will get an IP address that the router thinks is on the external network. So, 168.192.x.x is on an external server. If you type in whois 168.192.12.13, you find the poor netblock that has to put up with all of these mistyped IP address numbers from machines all over the world. # whois 168.192.12.13 OrgName: Sprint OrgID: SPDN Address: 12502 Sunrise Valley Dr City: Reston StateProv: VA PostalCode: 20196 Country: US NetRange: 168.191.0.0 - 168.193.255.255 CIDR: 168.191.0.0/16, 168.192.0.0/15 ... and so on ... We once had a telephone number that was only one digit away from a petrol service station's telephone number. We used to get the occasional call from someone wanting the service station. I'm willing to bet that Sprint gets a lot of traffic from Windows machines. |
Super-searches with Regular ExpressionsSearches through log files using the standard 'Find' function on most text editors can be a little limited. Normally, you can only look for one block at a time or you have to learn some proprietary language to access the inner workings of the editor. However, with regular expressions, you only have to learn how to use a common 'language' that applies to all regular expression situations, whether that is in a simple text editor, a word processor such as OpenOffice.org, a file finder or a programming language such as Perl. You can open a new browser window to see a real log file extract that you can play around with by clicking here. These are extracts (one with UNIX line ends (suitable for Linux/BSD and so on) and one with DOS line ends that you can open in Windows). Once they are in your text editor, you can play around with the regular expressions. The extract itself (extracted using 'grep') is from a failed 'script-kiddie' attack on a web server (wrong OS, server and patch level for the attack to succeed) and it is interesting to see how they try to compromise a server (in this case, they thought is was an unpatched IIS server - if they thought is was anything). Say that we are interested in the occurrences of lines where they try to use 'index' with 'passwd'. If we use a search string of 'index', we get 69 occurrences. If we look for 'passwd', we get 40 occurrences. Matching these up with each other would be time consuming so we use a better method - this time looking for both strings. In the window that you would normally type our search string, we can specify a number of other strings that allow parts to be tied down either to the beginning or the end of each line (or paragraph if you are using a word processor) and specify various types of characters that go in between. If we were looking at the whole log as opposed to an extract, we might want to start off with the IP address in question (this being a standard log file format, the IP addrress is at the beginning). The character that ties a string to the beginning of a line is the caret (^). So, if we were looking for an ip address 67.176.149.209 at the beginning of each line, we could say... ^67.176.149.209 and that would find all of the lines with 67.176.149.209 at the beginning. However, in regular expressions, the full stop is used as a character that represents any character so this would also catch lines that start with 67317641495209 although you wouldn't see these at the beginning of a log file like this so we are safe here. To represent a dot for our dotted quad, we need to escape it using a backslash to make '\.' so, although our line above would work in a web server log file, it would be more correct to say ^67\.176\.149\.209 and now, we only find the lines that start with 67.176.149.209. If we found that they had been using a number of address values between 67.176.149.0 and 67.176.149.255, we could truncate our specification to ^67\.176\.149 and that would find them. Note that, as we have specified that the start of this string should be at the beginning of the line, it will not pick up on IP addresses such as 23.67.176.149 as that doesn't match. If a range of 67.176.149.200 to 67.176.149.239 was used and there are other lines in there, say from 67.176.149.143, that you are not interested in, you can look for the 200 to 239 lines by using the following... ^67\.176\.149\.2[0123]\d At the end of this, you will see that we look for a '2' and then, one of the characters in the square brackets (0 to 3 inclusive) and then any digit '\d'. There are a number of these character type representations using escape codes.
and if you use the uppercase version, it means not that so \D is a character other than 'a digit from 0 to 9 inclusive'. You can have more than one as well. In DOS, we are familiar with using an asterisk (*) to represent a number of characters and here, if we follow a specification for a character, it has a similar meaning.
Instead of just a single character (in square brackets) you can have a set of characters such in round brackets such as (na) so, you can look for ba(na)+ which will find 'bana', 'banana' and 'bananana' but not 'ba' in the same way that '+' is used above. You can also specify a number of times something should appear so if you want to find banana 'using' the above regex, just modify it to ba(na){2,2} which will find 'banana' and then the beginning of 'bananana' - the first 2 is the minimum number of repeats required and the last 2 is the maximum number so if you wanted between 2 and 4 inclusive, you would use {2,4}. If you want to limit it to a whole word with two or three occurrences of 'na', you can use a word boundary using an escaped b (\b) like so ... \bba(na){2,3}\b
... which will pick up banana and bananana but none of the others. If you want 'this' or 'that', you can use a split vertical bar in the round brackets either like ... (this|that) ... or, if you are more cunning ... th(is|at) To tie a string to the beginning of the line/paragraph, we have already seen that you use a caret (^) but to tie it to the end, you use a dollar sign ($). So, if we wanted a line that started with a '67.176', had a number of characters then either 'index' or 'cgi-bin', then 'passwd', we could use ... ^67\.176\w+(index|cgi-bin)\w+passwd See if you can work out what we need for the original problem. |
SAP packets in TCPDumpYou can view the traffic on your network using a number of tools but like the saying that goes something along the lines of: 'A man with one watch knows exactly what the time is but a man with two never does', if you use more than one packet sniffer, you can be put in a state of confusion. With TCPDump on OpenBSD, you might pick up the odd packet that looks like 06:31:09.807761 0:c0:2:77:66:15 > 3:0:0:0:0:1 sap f0 ui/C len=163 which looks like a SAP packet (IPX). However, using TCPDump in SuSE Linux (8.2 Professional), the same packet looks like this (The clocks on the two machines are not exactly the same). 06:31:18.844917 NetBeui Packet If you look at the same packet with Ethereal, it looks like this... |
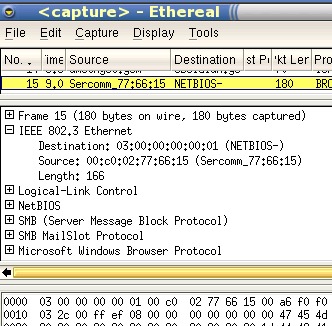 |
| Which shows that it is a SMB packet - the mac address
(00:c0:02:77:66:15) ties in with a printer server. However, there is a different type of printer server on this network and that produces the following with TCPDump on OpenBSD... 06:48:26.498854 0:c0:2:a5:ba:b5 Broadcast 8137 60:
ffff 0022 0004 0000 0000 ffff ffff ffff
0452 0000 0000 00c0 02a5 bab5 4013 0003
0004 bab5 4013 0003 0004 2045 4d45
06:48:26.499176 0:c0:2:a5:ba:b5 Broadcast 8137 60:
ffff 0022 0004 0000 0000 ffff ffff ffff
0452 0000 0000 00c0 02a5 bab5 4013 0001
0004 bab5 4013 0003 0004 2045 4d45
06:48:26.499514 0:c0:2:a5:ba:b5 Broadcast 8137 60:
ffff 0022 0004 0000 0000 ffff ffff ffff
0452 0000 0000 00c0 02a5 bab5 4013 0001
0278 bab5 4013 0003 0004 2045 4d45
06:48:26.499850 0:c0:2:a5:ba:b5 > Broadcast sap e0 ui/C len=43
06:48:26.500191 0:c0:2:a5:ba:b5 > Broadcast sap e0 ui/C len=43
06:48:26.500529 0:c0:2:a5:ba:b5 > Broadcast sap e0 ui/C len=43
06:48:26.500865 0.00:c0:02:a5:ba:b5.4013 > 0.ff:ff:ff:ff:ff:ff.452: \
ipx-sap-nearest-req 4 'M-:M-5@^S'
06:48:26.501198 0.00:c0:02:a5:ba:b5.4013 > 0.ff:ff:ff:ff:ff:ff.452: \
ipx-sap-req 4 'M-:M-5@^S'
06:48:26.501535 0.00:c0:02:a5:ba:b5.4013 > 0.ff:ff:ff:ff:ff:ff.452: \
ipx-sap-req 278 'M-:M-5@^S'
06:48:26.501885 0:c0:2:a5:ba:b5 > Broadcast sap aa ui/C len=35
06:48:26.502238 0:c0:2:a5:ba:b5 > Broadcast sap aa ui/C len=35
06:48:26.502589 0:c0:2:a5:ba:b5 > Broadcast sap aa ui/C len=35
which shows four sets of three packets (I've wrapped the longer lines (06:48:26.500865 to 06:48:26.501535) so that they will fit on the page). On SuSE Linux, they look like this... 06:48:35.584180 0.00:c0:02:a5:ba:b5.4013 > 0.ff:ff:ff:ff:ff:ff.452: \
ipx-sap-nearest-req 4
06:48:35.584513 0.00:c0:02:a5:ba:b5.4013 > 0.ff:ff:ff:ff:ff:ff.452: \
ipx-sap-req 4
06:48:35.584850 0.00:c0:02:a5:ba:b5.4013 > 0.ff:ff:ff:ff:ff:ff.452: \
ipx-sap-req 278
06:48:35.585187 0.00:c0:02:a5:ba:b5.4013 > 0.ff:ff:ff:ff:ff:ff.452: \
ipx-sap-nearest-req 4
06:48:35.585526 0.00:c0:02:a5:ba:b5.4013 > 0.ff:ff:ff:ff:ff:ff.452: \
ipx-sap-req 4
06:48:35.585864 0.00:c0:02:a5:ba:b5.4013 > 0.ff:ff:ff:ff:ff:ff.452: \
ipx-sap-req 278
06:48:35.586198 0.00:c0:02:a5:ba:b5.4013 > 0.ff:ff:ff:ff:ff:ff.452: \
ipx-sap-nearest-req 4
06:48:35.586534 0.00:c0:02:a5:ba:b5.4013 > 0.ff:ff:ff:ff:ff:ff.452: \
ipx-sap-req 4
06:48:35.586871 0.00:c0:02:a5:ba:b5.4013 > 0.ff:ff:ff:ff:ff:ff.452: \
ipx-sap-req 278
06:48:35.587220 0.00:c0:02:a5:ba:b5.4013 > 0.ff:ff:ff:ff:ff:ff.452: \
ipx-sap-nearest-req 4
06:48:35.587572 0.00:c0:02:a5:ba:b5.4013 > 0.ff:ff:ff:ff:ff:ff.452: \
ipx-sap-req 4
06:48:35.587927 0.00:c0:02:a5:ba:b5.4013 > 0.ff:ff:ff:ff:ff:ff.452: \
ipx-sap-req 278
(again, wrapped so that they will fit). In Ethereal (on SuSE), they look like this... |
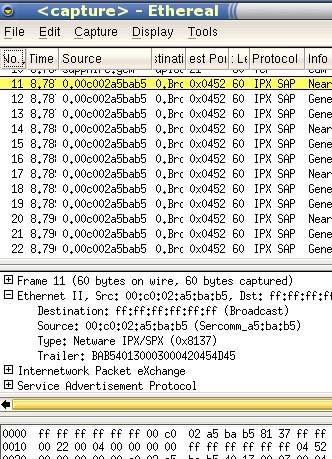 |
| Which recognises these as IPX SAP packets. They are broadcast packets that happen fairly infrequently so they are no threat to your network. Open a new browser with the directory with the tcpdump extracts in by clicking here |
Locating Rogue Network Machines using EtherApeIf you want all of your LAN traffic to go through a proxy that you have set up, you need to be sure that people aren't using browsers on the LAN that bypass it. You can configure your proxy so that it picks up everything on port 80 and processes that regardless of where it originated but if you need to use port 80 without going through a proxy for some reason (web counter monitoring or similar uses where it might be easier or more convenient) you need to keep an eye on where any rogue machines might be.
In the screenshot on the right (EtherApe running on OpenBSD but you can get it for other OSes), you can see that 192.168.1.140 is sending ftp data directly to an outside IP address but other traffic is staying within the network. |
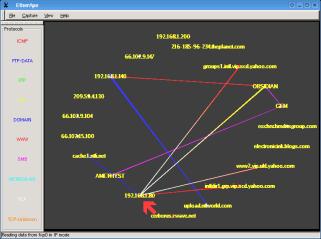 In this
shot, you can see that 192.168.1.80 (red arrow) is
accessing directly machines all over the Internet using
http because its browser is now configured not to use
port 3128 for web proxy - smb still goes through
Obsidian. Each protocol has a different colour. In this
shot, you can see that 192.168.1.80 (red arrow) is
accessing directly machines all over the Internet using
http because its browser is now configured not to use
port 3128 for web proxy - smb still goes through
Obsidian. Each protocol has a different colour.Etherape will capture packets in the same way that tcpdump and Ethereal will so you can both monitor your network segment and, fill up your machine's memory if you forget to stop it from doing so. In addition, you need to access your interface as root to run this in the same way as you do with other packet sniffers. |
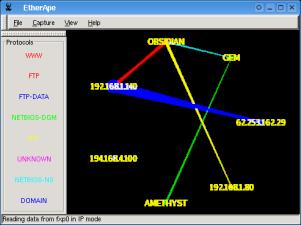 With Etherape, you
can see each node on your network and any that are being
communicated with directly, outside your network. If you
have a number of PCs that all go through a proxy, you
should only see traffic lines through that proxy.
With Etherape, you
can see each node on your network and any that are being
communicated with directly, outside your network. If you
have a number of PCs that all go through a proxy, you
should only see traffic lines through that proxy.Default BIOS PasswordsMany BIOSes have a default password that will allow access to both the BIOS configuration and to the rest of the machine (ie, boot up your OS) whether or not you have set the password. This means that regardless of how strong a password you have chosen for your computer, people will just be able to bypass it. This has serious implications for people who think that BIOS passwords are a significant block to accessing a computer and you should be aware of this. There is at least one virus that will set your BIOS password to the default password so, even if you have never set your BIOS password, you might find that one day, it asks you for one. The other application for needing to know the default password is if you have set your own password and have sice forgetten it. So, where do you start? First of all, you need to find out which BIOS you are using. There are four main BIOS manufacturers: Award; AMI; Phoenix and IBM although there have been tests and exercises in reverse engineering on other BIOSes with some surprising results. Rather than me try to list here all of the passwords that you can try, the best thing you can do is look on the Internet and the best place to start off is with a search engine such as Google using "BIOS password" (with the quotes). Some resources are:
and so on. |
Using NetStat on Windows and UnixIf you need to find out which sockets are open on a system, netstat will provide you with your answers. WindowsOn a windows system, just typing 'netstat' (no quotes) will give you a list of all of the established connections similar to the following: D:\>netstat Active Connections Proto Local Address Foreign Address State TCP emerald:1043 localhost:2432 ESTABLISHED TCP emerald:1043 localhost:2480 ESTABLISHED TCP emerald:2432 localhost:1043 ESTABLISHED TCP emerald:2480 localhost:1043 ESTABLISHED TCP emerald:telnet amethyst:3671 ESTABLISHED D:\> However, that is not all that it can do. If you add the '-a' flag (so that your line now looks like 'netstat -a'), you will get list that includes ports that are being listened on as well. If you have a web server running that you were not aware of, that will show up as a line with the machine name (emerald in the example above) followed by a colon and then 'http'. Adding '-b' will give details of which programs (or chains of programs) are running a particular port or connection. Combining this with -a (ie 'netstat -ab') will combine the commands. If you want to get it to wait for a while and then show you the new statistics, just put a number at the end of the command line sequence. To see more options, type 'netstat /?' at the command line. LinuxNetstat on a Linux box gives a lot more output because of the way that Unix-like operating systems use sockets. Typing netstat without any switches on a linux box gives a list of the network connections as well as the UNIX domain sockets in use. # netstat Active Internet connections (w/o servers) Proto Recv-Q Send-Q Local Address Foreign Address State tcp 0 0 obsidian.gem:www-http 200-89-69-112.uch:53050 ESTABLISHED tcp 362 10 obsidian.gem:smtp 3.Red-83-56-229.:cecsvc ESTABLISHED tcp 0 0 obsidian.ge:netbios-ssn amethyst.gem:datusorb ESTABLISHED tcp 220 0 obsidian.gem:smtp 221.127.168.62:3965 ESTABLISHED tcp 0 0 obsidian.gem:smtp 12-226-91:mctet-gateway ESTABLISHED tcp 0 0 obsidian.gem:smtp matrix.net24.pl:here-lm ESTABLISHED tcp 174 0 obsidian.gem:smtp 222.248.229.217:4171 ESTABLISHED tcp 187 0 obsidian.gem:smtp 218.94.152.26:ac-tech ESTABLISHED tcp 0 0 localhost:39410 localhost:39409 ESTABLISHED tcp 487 0 obsidian.gem:smtp matrix.net24:lavenir-lm ESTABLISHED tcp 97 0 obsidian.gem:smtp pool-71-109:commonspace ESTABLISHED tcp 0 0 localhost:39407 localhost:39408 ESTABLISHED tcp 0 0 obsidian.gem:smtp matrix.net24.p:itm-mccs ESTABLISHED tcp 457 0 obsidian.gem:smtp matrix.net24.pl:cifs ESTABLISHED tcp 0 0 obsidian.gem:37477 amethyst.ge:netbios-ssn ESTABLISHED tcp 0 0 localhost:39412 localhost:39411 ESTABLISHED tcp 0 0 localhost:39409 localhost:39410 ESTABLISHED tcp 0 0 localhost:39414 localhost:39413 ESTABLISHED tcp 336 0 obsidian.gem:smtp matrix.net24.pl:4137 ESTABLISHED tcp 0 0 localhost:39411 localhost:39412 ESTABLISHED tcp 0 0 localhost:39413 localhost:39414 ESTABLISHED tcp 0 0 obsidian.gem:smtp vsmtp3alice.tin.i:42656 ESTABLISHED tcp 706 0 obsidian.gem:smtp c9263a93:pfu-prcallback ESTABLISHED tcp 0 0 obsidian.gem:smtp 201-27-91-:vsat-control ESTABLISHED tcp 721 0 obsidian.gem:smtp 61.254.13.135:pcihreq ESTABLISHED tcp 6 223 obsidian.gem:smtp 221.127.134.61:4162 ESTABLISHED tcp 882 0 obsidian.gem:smtp 221.126.228.56:4384 ESTABLISHED tcp 0 0 localhost:39408 localhost:39407 ESTABLISHED tcp 541 0 obsidian.gem:smtp sanytas.krsk:tl1-telnet ESTABLISHED tcp 0 0 obsidian.gem:44357 amethyst.ge:netbios-ssn ESTABLISHED tcp 0 0 obsidian.gem:smtp rekin6.go2.pl:49603 ESTABLISHED tcp 131 70 obsidian.gem:smtp 60.216.200.60:4204 ESTABLISHED tcp 143 0 obsidian.gem:smtp p2164-ip:mgcp-callagent ESTABLISHED tcp 94 0 obsidian.gem:smtp 220.179.111.69:monp ESTABLISHED tcp 0 0 obsidian.gem:smtp smtp01.bwc.na.bla:62178 ESTABLISHED tcp 875 0 obsidian.gem:smtp c-24-30-88-174:sm-pas-2 ESTABLISHED tcp 1 0 obsidian.ge:filenet-tms amethyst.ge:netbios-ssn CLOSE_WAIT tcp 438 0 obsidian.gem:smtp cpc1-chel1-6-:ptk-alink ESTABLISHED tcp 923 0 obsidian.gem:smtp 221.127.3:pktcable-cops ESTABLISHED tcp 104 0 obsidian:ssh amethyst:3679 ESTABLISHED Active UNIX domain sockets (w/o servers) Proto RefCnt Flags Type State I-Node Path unix 17 [ ] DGRAM 1010 /dev/log unix 2 [ ] DGRAM 1012 /var/lib/named/dev/log <snipped 320 lines from this list> unix 2 [ ] DGRAM 1268 Active IPX sockets Proto Recv-Q Send-Q Local Address Foreign Address State Active AX.25 sockets Dest Source Device State Vr/Vs Send-Q Recv-Q # With such a powerful command, there are, of course, ways of notifying the output so that you get more of what you want and less of what you don't. If you look at the manual pages for netstat, ('man netstat'), you can see what the options are. If you wanted to see the numeric address and port information for sockets, you might choose netstat -atn except that doing so would give you a longer list than you needed. So, you can take the output and use grep to narrow it down like so... # netstat -atn | grep LISTEN tcp 0 0 0.0.0.0:515 0.0.0.0:* LISTEN tcp 0 0 0.0.0.0:37 0.0.0.0:* LISTEN tcp 0 0 0.0.0.0:7 0.0.0.0:* LISTEN tcp 0 0 0.0.0.0:9098 0.0.0.0:* LISTEN tcp 0 0 0.0.0.0:9099 0.0.0.0:* LISTEN tcp 0 0 0.0.0.0:139 0.0.0.0:* LISTEN tcp 0 0 0.0.0.0:13 0.0.0.0:* LISTEN tcp 0 0 192.168.168.200:110 0.0.0.0:* LISTEN tcp 0 0 0.0.0.0:111 0.0.0.0:* LISTEN tcp 0 0 0.0.0.0:6000 0.0.0.0:* LISTEN tcp 0 0 0.0.0.0:80 0.0.0.0:* LISTEN tcp 0 0 0.0.0.0:10000 0.0.0.0:* LISTEN tcp 0 0 0.0.0.0:6001 0.0.0.0:* LISTEN tcp 0 0 0.0.0.0:21 0.0.0.0:* LISTEN tcp 0 0 192.168.1.254:53 0.0.0.0:* LISTEN tcp 0 0 192.168.168.200:53 0.0.0.0:* LISTEN tcp 0 0 127.0.0.1:53 0.0.0.0:* LISTEN tcp 0 0 0.0.0.0:631 0.0.0.0:* LISTEN tcp 0 0 0.0.0.0:23 0.0.0.0:* LISTEN tcp 0 0 192.168.1.254:3128 0.0.0.0:* LISTEN tcp 0 0 127.0.0.1:25 0.0.0.0:* LISTEN tcp 0 0 192.168.168.200:25 0.0.0.0:* LISTEN tcp 0 0 127.0.0.1:953 0.0.0.0:* LISTEN tcp 0 0 :::22 :::* LISTEN tcp 0 0 ::1:953 :::* LISTEN # With Linux (in this case SuSE linux), you can make netstat output the list continuously (once per second) using the '-c' flag ('netstat -c'). FreeBSDThe implementation of netstat on FreeBSD is slightly different again. If you type 'man netstat', you can see the manual pages for it, showing you all of the options. Netstat on its own gives a similar output to SuSE Linux's... $ netstat Active Internet connections Proto Recv-Q Send-Q Local Address Foreign Address (state) tcp4 0 0 emerald.gem.ssh obsidian.gem.46236 ESTABLISHED tcp4 0 0 emerald.gem.58434 obsidian.gem.netbios-s ESTABLISHED Active UNIX domain sockets Address Type Recv-Q Send-Q Inode Conn Refs Nextref Addr c2496604 stream 0 0 0 c24964ec 0 0 /tmp/.ICE-unix/dcop560-1129120538 c24964ec stream 0 0 0 c2496604 0 0 c22dbc08 stream 0 0 0 c21109d8 0 0 /tmp/.X11-unix/X0 c21109d8 stream 0 0 0 c22dbc08 0 0 c2496230 stream 0 0 0 c2110c94 0 0 /tmp/.ICE-unix/dcop560-1129120538 c2110c94 stream 0 0 0 c2496230 0 0 c2110c08 stream 0 0 0 c21102bc 0 0 /tmp/.X11-unix/X0 c21102bc stream 0 0 0 c2110c08 0 0 <snipped 110 lines> c1cdfdac dgram 0 0 c1ce2c60 0 c1cdfaf0 0 /var/run/log $ FreeBSD's netstat does support a timed option and this gives out the traffic stats in terms of input and output packets and bytes. $ netstat -w 5
input (Total) output
packets errs bytes packets errs bytes colls
18 0 123548 16 0 33886 0
295 0 16013 280 0 8327 0
132 0 70344 120 0 14015 1
2 0 435 3 0 490 0
14 0 36922 15 0 14544 0
110 0 4737 108 0 558 0
1 0 106 2 0 224 0
1 0 106 2 0 224 0
1 0 106 2 0 224 0
2 0 239 3 0 294 0
30 0 7839 31 0 5571 0
3 0 301 3 0 294 0
12 0 11195 10 0 752 0
1 0 3687 2 0 1079 0
499 0 731895 347 0 22598 1
2 0 239 3 0 294 0
2 0 207 3 0 294 0
1 0 241 2 0 294 0
194 0 224235 145 0 14118 13
^C
$
OpenBSDLike FreeBSD, OpenBSD has the -w (wait) option and its output is like this: # netstat -w 5
lo0 in lo0 out total in total out
packets errs packets errs colls packets errs packets errs colls
0 0 0 0 0 2 0 2 0 0
0 0 0 0 0 2 0 3 0 0
0 0 0 0 0 13 0 13 0 0
0 0 0 0 0 27 0 28 0 0
0 0 0 0 0 19 0 20 0 1
0 0 0 0 0 18 0 19 0 1
0 0 0 0 0 243 0 225 0 1
0 0 0 0 0 861 0 807 0 3
0 0 0 0 0 4 0 5 0 0
0 0 0 0 0 24 0 25 0 0
0 0 0 0 0 207 0 169 0 0
0 0 0 0 0 7 0 7 0 0
0 0 0 0 0 177 0 158 0 4
0 0 0 0 0 13 0 15 0 0
^C
#
Again, look at the manual entry ('man netstat') for more details. |